Exercice 4 - Internal radiation therapy
TRT
Targeted radionuclide therapy (TRT) delivers radiation to lesions by
administration of radiolabeled molecular agents designed to
specifically concentrate into targets. We want now to create a
simulation of such a treatment (internal radiation therapy). Macros
will be in the folder internal-rt/.
Step 1
To start, we first study some radionuclides. Create from scratch a simple simulation that allow you to get the energy spectrum of the e- emitted by a source of Yttrium-90 in a vacuum. Energy spectrum may be recorded with a EnergySpectrumActor or a PhaseSpaceActor. Plot the energy spectrum.
In GATE, a source of a radionuclide is defined with some macro like:
    /gate/source/addSource Yttrium
    /gate/source/Yttrium/gps/particle ion
    /gate/source/Yttrium/gps/ion 39 90 0 0
    /gate/source/Yttrium/gps/type Volume
    /gate/source/Yttrium/gps/shape Sphere
    /gate/source/Yttrium/gps/radius 1.5 mm
    /gate/source/Yttrium/gps/angtype iso
    /gate/source/Yttrium/gps/centre 0. 0. 0. mm
    /gate/source/Yttrium/gps/energy 0 MeV
Do not forget to add the radioactive decay process:
    /gate/physics/addProcess RadioactiveDecay
    /gate/physics/addPhysicsList emstandard_opt3
Use a Filter to record separately the energy spectrums for e- and gamma.
Analyze the emitted e- and gamma from other radionuclides used for treatment, for example Lutetium-177 or Iode-131. You may also consider radionuclides used for imaging: Indium-111 (SPECT), Gallium-68 (PET) or Fluor-18 (PET).
Information can be found on http://www.nucleide.org/DDEP_WG/DDEPdata.htm.
Step 2
Modify the previous simulations in order to plot the depth dose curve of the radionuclides in water. You may have to change the direction of emission of the source along a defined direction. Consider a depth resolution of for example, 0.2 mm.
What are the differences in absorbed dose according to the radionuclides ?
Step 3
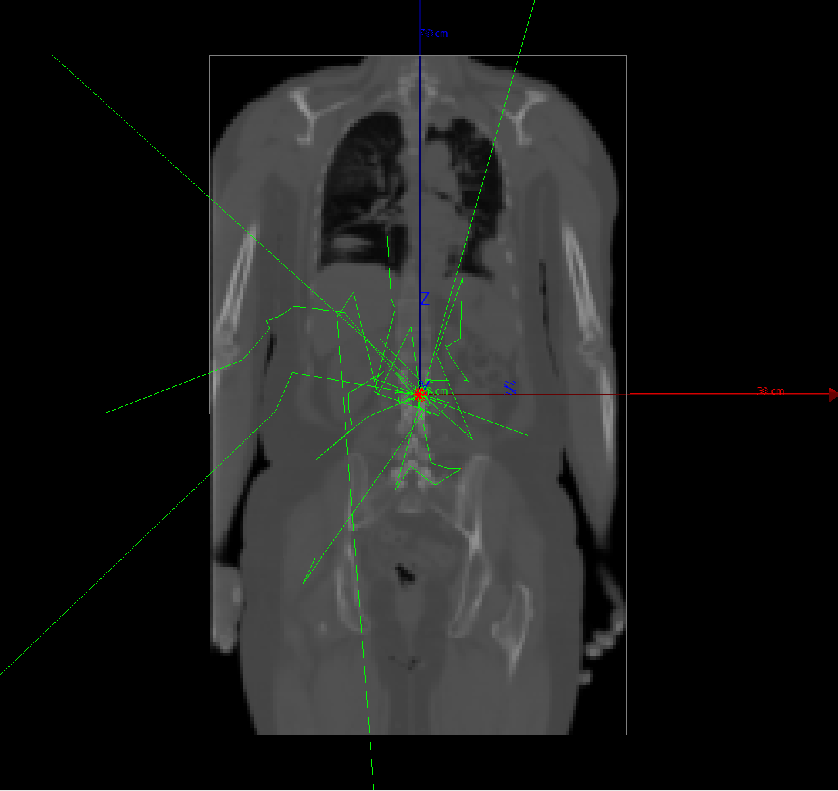
We will now learn to use a "voxelized source". This is an emitting source of particles described as a spatial distribution with a matrix of pixel intensity. Several SPECT images have been calibrated and merged together to produce a time-integrated activity emission map (TIA) associated with a patient CT. Consider the simulation that uses this TIA as a voxelized source, see macros main.mac and source-vox.mac in the folder 4_internal_rt. The pixels in the TIA image are expressed in MBq.h.
Perform a simulation, analyze the results.
Step 4
Change the voxelized source to a simple point source in the middle of the patient. Then, change the radionuclide, for example by using Lutetium-177 or Iode-131 or any radionuclides you like in http://www.nucleide.org/DDEP_WG/DDEPdata.htm. You may look at the source-gps.mac file.
What are the differences in absorbed dose according to the radionuclides ?